Seeing Is Believing: Visualizing 5G mmWave Coverage at Lumen Field with Cyclops
By Melroy Machado
If you’ve ever tried to deploy 5G mmWave in a large venue, you already know that RF measurements alone don’t tell the full story.
In dense, reflective environments like stadiums, signals bounce, diffract, and reflect in ways that don’t always line up with modelling tools. Engineers can walk test and measure RSRP, SINR, and throughput, but they can still struggle to answer the most basic question:
Where is this signal actually coming from?
That question is exactly why we brought Cyclops, Pivotal Commware’s portable mmWave visualization tool, to Lumen Field, home of the Seattle Seahawks, for a real-world trial with a Tier 1 operator’s field team. The goal? Visualize 5G mmWave coverage in and around the stadium environment and validate how quickly, accurately, and intuitively Cyclops could visualize 5G mmWave signals in the field.
Why Stadiums Stress-Test mmWave Networks
Stadiums are one of the most demanding environments for 5G mmWave. Aside from being in dense urban surroundings with large reflective structures, these venues also experience rapid changes in crowd density and usage patterns across multiple small cells and sectorized radios. In other words, when crowds move around during the game, that movement can impact coverage patterns.
A stadium setting also exposes a key limitation of traditional test-and-measurement workflows. Legacy tools can tell you what the signal looks like, but not why it behaves the way it does. You can get KPIs from legacy mobile handsets, but they won’t tell you where the signal is coming from. Professional testing equipment is clunky and expensive—and you need to be technically savvy to operate it.
Cyclops: RF Visualization Meets Reality
This predicament is exactly why we designed Cyclops. It’s a battery-powered, ultra-portable mmWave scanner that combines RF measurements with real-time visual overlays, allowing engineers to see signal origin on a live camera view, alongside decoded 5G KPIs.
In practical terms, Cyclops enables lightly trained field engineers to:
- Identify which gNB a signal originates from.
- Distinguish direct paths from reflections or ground bounces.
- Validate coverage assumptions in minutes, not hours.
- Make informed design and deployment decisions on the spot.
And they can do it all with a device that fits in a backpack and sets up in under five minutes.
The Lumen Field Cyclops Field Trial
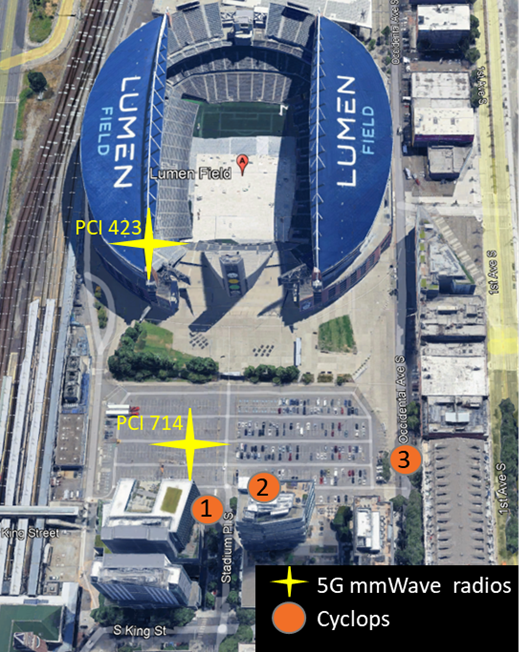
Working with a Tier 1 operator’s field team, we used Cyclops to map 5G mmWave coverage around Lumen Field, focusing on the surrounding parking lot and perimeter areas. Testing was conducted at three outdoor locations to understand how coverage changed across vantage points.
Location 1: North Side (Outside Embassy Suites)
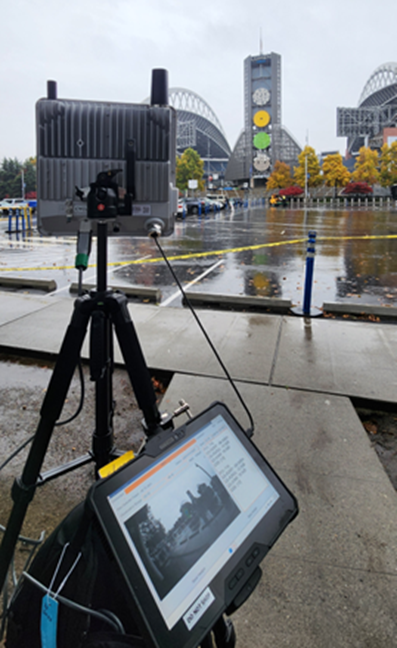
At the first location, Cyclops immediately detected a parking lot small cell serving the area. The system visually mapped the gNB and decoded live KPIs, showing:
- RSRP: -93 dBm
- SINR: 18.5 dB
The signal source was clearly identifiable and consistent with expected coverage patterns, confirming solid mmWave performance from this location.
 Tablet GUI display of a 5G mmWave signal coming from a parking lot small cell (blue hue) and measured KPIs
Location 2: Outside Stadium Place
From a second vantage point, Cyclops again identified the same parking lot cell site, this time measuring:
- RSRP: -79 dBm
- SINR: >20 dB
Notably, no additional stadium-mounted radios were detected from this angle—likely due to antenna orientation. This was a useful validation point, reinforcing how beam directionality and placement affect real-world visibility.
Location 3: Outside Elysian Brewing
At the third location, Cyclops provided the most complete picture. In addition to the parking lot cell site, the system also identified additional mmWave radios installed on the stadium structure itself.
Measured performance included:
- Parking lot small cell:
- RSRP: -93 dBm
- SINR: >20 dB
- Stadium-mounted small cell:
- RSRP: -92 dBm
- SINR: >20 dB
 Cyclops: Spatial RF Visualization of 5G mmWave Signals
In one scan, the field team could see multiple signal sources, understand their relative contributions, and confirm strong link quality without switching tools or post-processing data later.
Why This Matters for Tier 1 Operators
For fans, 5G mmWave is crucial for a better game day experience. Higher 5G capacity in and around the stadium means they can upload and download game day content to social media in real time. Field engineers need to ensure strong 5G coverage so fans can enjoy seamless connectivity during the game (which is exactly why Verizon advised Super Bowl attendees in 2024 and 2025 to avoid the stadium’s public Wi-Fi network and use 5G instead).
Our demonstration highlighted how visual RF intelligence changes field operations. In practical deployments, field teams can walk the perimeter of a stadium (or any dense venue) and instantly visualize coverage boundaries, gaps, and overlaps. They can determine whether reflections are durable (from fixed structures) or transient (from vehicles or temporary objects) and optimize radio placement or sector orientation with confidence.
Instead of guessing or sending specialized RF engineers back for repeat visits, Cyclops gives field teams immediate clarity. That translates directly into fewer truck rolls/site-visits, faster deployments, and better first-time-right performance.
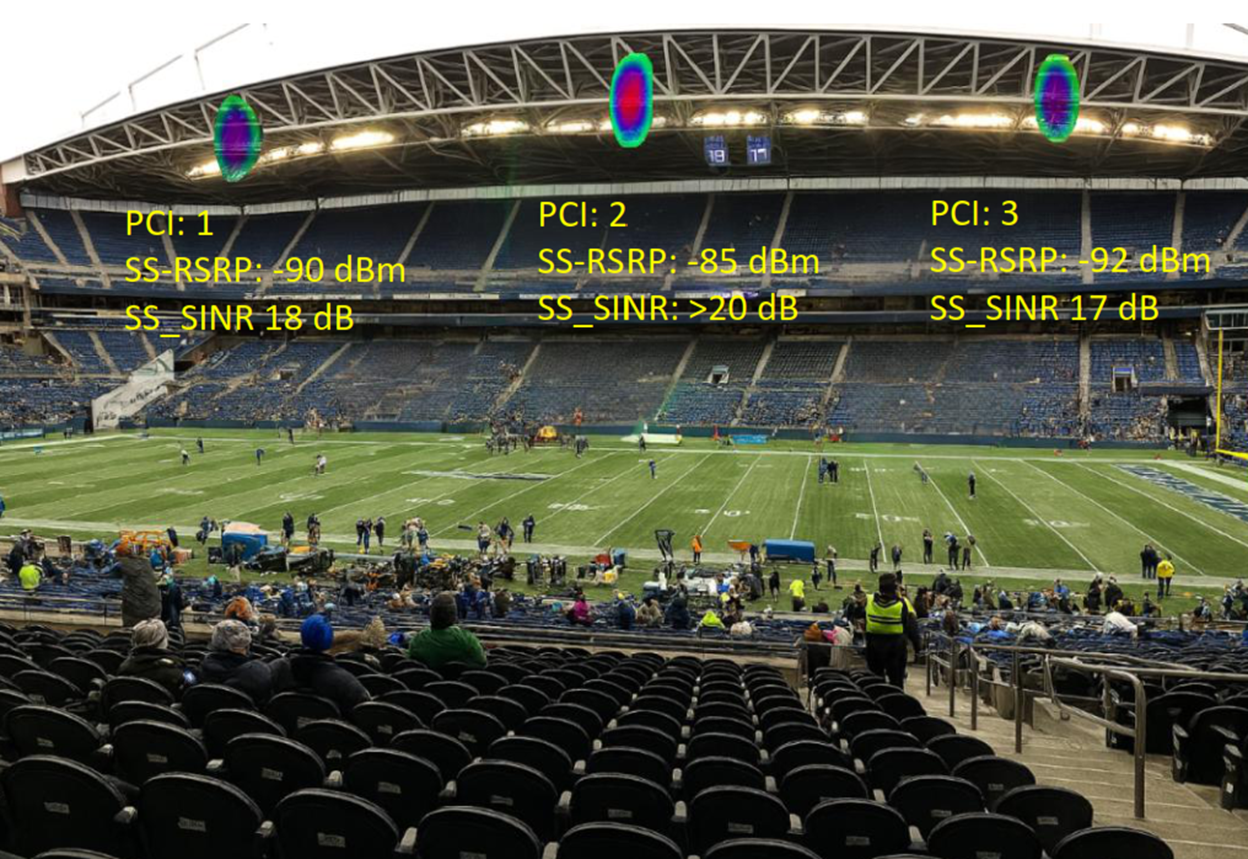 Concept visualization of 5G signal origin in-stadium
From Stadiums to Scaled Deployments
While this trial focused on a stadium environment, the implications extend far beyond game day.
The same challenges—complex propagation, reflections, and uncertainty—exist in urban FWA rollouts, transportation hubs, dense downtown corridors, and disaster recovery scenarios. Anywhere mmWave is deployed at scale, knowing where a signal originates is just as important as knowing how strong it is.
Cyclops turns RF from an abstract dataset into something engineers can see, understand, and act on in real time. And as mmWave networks continue to expand, Tier 1 operators need that level of certainty to win.